Debug Sessions
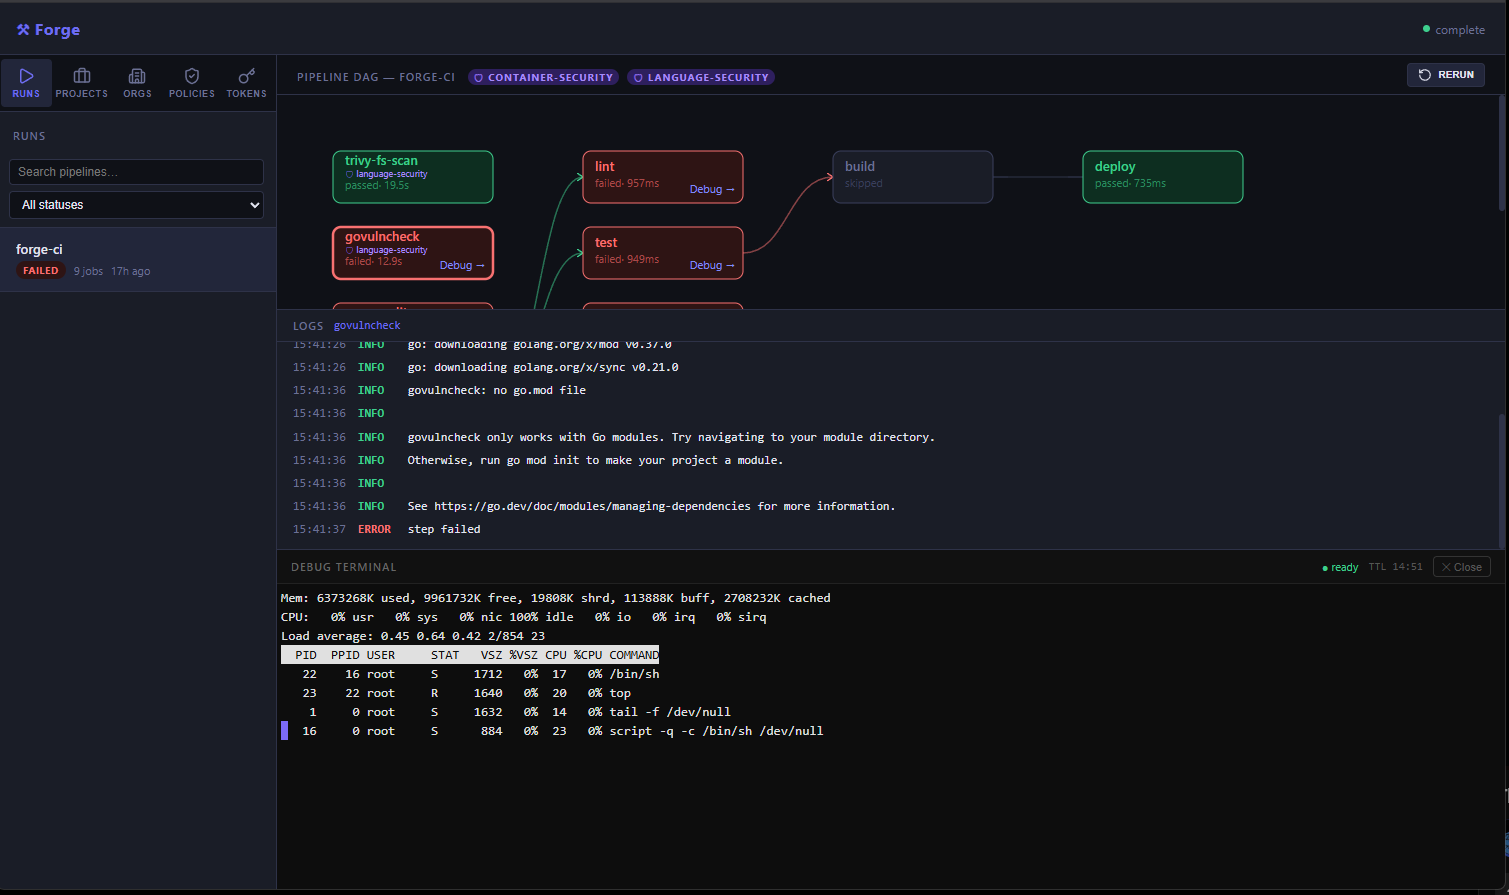
One of Forge's most powerful features: when a job fails, you can open a live terminal session directly into the container in the exact environment where the failure occurred. No more guessing from log output.
How It Works
- Click "Debug →" on any failed (or running) job in the Web UI
- The scheduler creates a debug session and requests an agent to start a container
- The container uses the same image and workspace as the failing job
- Your browser connects to the scheduler's WebSocket proxy
- The scheduler triggers the agent to "dial back" to it, creating a secure internal tunnel
- A full interactive terminal appears, powered by xterm.js
The terminal is connected to the container via script, which allocates a real PTY inside the Linux container. This works regardless of your operating system because the PTY is in the container's kernel, not the host.
Using Debug Sessions
Opening a Session
In the Web UI, click "Debug →" on any job node. The panel slides in at the bottom of the screen.
The session status transitions: - ● starting container… — agent is creating the container - ● ready — terminal is live, type away
What You Can Do
The workspace from the failing job is mounted at /workspace. Everything that was present when the job ran is still there — source files, partial build outputs, downloaded dependencies.
# Navigate to the workspace
cd /workspace

# Check what files exist
ls -la

# Re-run the failing command
go test ./... -v

# Inspect environment variables
env | sort

# Check if a secret was injected correctly
echo $MY_SECRET

# Look at build artifacts
ls -lh dist/

# Run a debugger
dlv debug ./cmd/myapp
TTL and Timeout
Sessions expire after 15 minutes of inactivity (configurable). The TTL countdown is shown in the terminal header. Each command you run resets the countdown.
Closing a Session
Click ✕ Close to end the session. The container is immediately stopped and removed.
What the Terminal Gives You
Since script allocates a proper PTY inside the container, you get the full interactive experience:
| Feature | Works? |
|---|---|
| Colors and ANSI escape codes | ✅ |
| Tab completion | ✅ |
| Arrow keys / command history | ✅ |
| Interactive programs (vim, htop, top) | ✅ |
| Ctrl+C to interrupt a running command | ✅ |
| Multiple commands without re-running | ✅ |
Background jobs (&) |
✅ |
Network Architecture
Debug terminals use a reverse connection model. Instead of the browser connecting to agents, the browser connects to the scheduler, which then coordinates with the agent. The agent establishes an outgoing connection to the scheduler to bridge the terminal traffic.
This means: - Agents do not need to expose any ports (no 8082, 8083, etc.) - All traffic goes through the scheduler (port 8080 or 443) - Works seamlessly behind NAT, firewalls, and reverse proxies
Security Considerations
Debug terminals are authenticated via your API token, included in the WebSocket URL. The scheduler validates this token before proxying any traffic to the agent.